CenterPoint® Accounting for Agriculture
- Working with Production Analysis (WIP)
Related Help
_24.jpg) Setting Up a Production Analysis Video - Duration: 16 min 56 sec
Setting Up a Production Analysis Video - Duration: 16 min 56 sec
Working with Production Analysis Video - Duration: 15 min 03 sec
MyJohnDeere Authorization Video - Duration: 2 min 42 sec
Calculations in Production Analysis Video - Duration: 7 min 20 sec

| Document #: | 3371 | Product: | CenterPoint® Accounting for Agriculture |
|---|
Production Analysis offers ways to adjust the display of your analysis, add and use other calculations in the analysis, enter “what if” scenarios, and adjust printed and exported reports.
This document includes the following topics:
File Menu Options
- Open - displays existing production analysis reports.
- The list can be ordered by any of the displayed columns by clicking the column heading.
- Select the analysis you want to work with and click OK.
- The Production Analysis currently open displays as the worksheet title at the bottom of the spreadsheet.
- Click New to create a new analysis.
- Click Delete to remove an existing analysis.
- New - displays the Analysis Properties screen to define a new analysis. Refer to the Understanding and Using Production Analysis (WIP) topic for detailed information.
- Save - updates the open production analysis. Changes in your selections of what you are analyzing and rows you have added are automatically saved while working in production analysis. “What if” changes in production analysis are not saved in an analysis. An analysis with “what if” changes can be exported to a file to save those changes.
- Save As - allows saving a new copy of the open analysis to a different name. Enter a new analysis name and select allows saving a new copy of the open analysis to a different name. Enter a new analysis name and select Save.Note: Changes in your selections of what you are analyzing or changes in the row options are automatically saved while working in production analysis.
- "What if” changes (strategy planning changes in analysis grid amounts, quantities, or performance measure values) are not saved in an analysis.
- “What if” changes will be reflected in printouts, exports, and maps while working in that analysis. When an analysis is closed, reopening the analysis reloads the current transaction activity and calculations.
- An analysis with “what if” changes can be exported to a file to save those changes.
- Properties - displays the Production Analysis Properties screen for modifications. Refer to the Understanding and Using Production Analysis (WIP) topic for detailed information.
- Reload - generates the production analysis with current transaction data and calculations.
- If you make value changes in the cells, Reload generates current transaction data and calculations
- Page Setup - allows modifications to printed reports. Production analysis prints the report header, the row titles, and the column titles on each page with one segment per page. If the analysis includes more columns than fits on portrait orientation, page setup can be used to make modifications.
- On the Page tab:
- Orientation - Allows you to select between Portrait or Landscape. Choose Landscape to allow additional columns.
- Scaling - allows condensing or expanding your printout using an Adjust to normal size or a Fit to page. Scale to a value lower than 100 to decrease print and allow additional columns.
- Paper Size - allows other page size options available for your printer.
- Click Print to print from Page Setup or click Preview to preview the report.
- The Margins tab allows manual customizing of page borders. Right and left margins can be decreased to allow additional columns.
- Header/Footer - allows custom changes in the header or footer text. Other header and footer options are available in the dropdown under Header: and Footer:. Select Custom Header / Footer to modify text in the header or footer.
- Sheet allows options for grid lines; black and white; draft quality in printing; option to include row and column headings; and page order preference.
- Click Print to print from Page Setup or click Print Preview to preview the report.
- On the Page tab:
- Print Spreadsheet - displays a Print dialog box to select the printer, number of copies, and page range you wish to print. Click Print.
- Preview Spreadsheet - displays a preview of the printed report.
- Production analysis printed or exported reports include the report header, row titles, column titles, and footer on each page with one segment per page.
- Print displays a Print dialog box to select the printer, number of copies, and page range you wish to print.
- Quick Print prints directly to the default printer.
- If adjustments are needed to fit all columns, use File > Page Setup to make modifications.
- To set the column width, right click on a column and select Set Column Width. Selecting Set Column Width displays the current width value. Increase the value to widen the column and decrease the value to narrow the column. Set Column Width adjusts that column in all segments
- The number of decimals in quantity columns are managed from the preference under File > Preferences > General > Quantity Decimal Settings. Select the Database tab and adjust the number of decimals if needed.
- Navigation icons
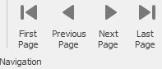 offer moving through the pages with First Page, Previous Page, Next Page, Last Page.
 - Zoom options
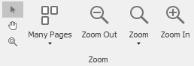 allow you to adjust the size of the view.
 - The Page Color drop- down allows you to modify the background color
- The Export options
 allow exporting to a folder location or emailing the file.
 - Selecting the down arrow to the right of Export To displays format options. Select the format. The next screen allows optional modifications for the selected format. Click OK to continue to file explorer screen. Select where you wish to save the file. Enter a file name and click Save.
- Selecting the down arrow to the right of Email As displays format options. Select the format. The next screen allows optional modifications for the selected format. Click OK to continue to file explorer screen. Select where you wish to save the file. Enter a file name and click Save. Next displays a Send Email screen with the file attached. Fill in the email address you wish to send the document and enter a message.
- Export Spreadsheet to Excel - displays a file explorer to select the location you wish to save the excel file. Select the folder location. Enter a File Name and click Save.
- Export Spreadsheet to PDF - displays a file explorer to select the location you wish to save the PDF file. Select the folder location. Enter a File Name and click Save.
- The Print Map, Preview Map, and Export Map to PDF generate production analysis maps. Refer to the document titled, “Working with Production Analysis Maps”.
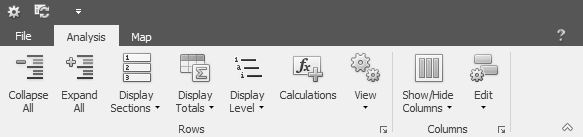
Analysis Menu Options
The Analysis menu provides the following functions:
- Collapse All
 condenses the rows to total rows included in the analysis.
 - Expand All
 expands all rows to the lowest level selected in Format Rows.
 - Display Selections
 manages the sections currently displayed. A checked section is displayed and an unchecked section is hidden. The sections are:
- Performance Measures display at the top of the analysis. Included Performance Measures are selected in Properties > Choose Performance Measures.
- Calculations display after the analysis data rows if calculations have been selected from Properties > Calculations Included or the Calculations icon.
- Notes can be entered for each segment in your analysis.
- In the Notes section at the bottom of the screen, position your mouse in “Enter notes here” cell to enter notes for that segment.
- Selections displays the report selections defined for the analysis if filters were assigned in Properties > Filter Data to Include.
- Display Totals
 manages which levels you wish to include total rows such as Account Type Totals or Account Category Totals. The options depend on the Display Level selected in Properties > Format Rows.
 - Display Level
 collapses and expands the analysis by the different account hierarchy levels. The options depend on the Display Level selected in Properties > Format Rows.
- Rows can also be collapsed and expanded independently in the analysis with the buttons at the left of the row titles. “+” indicates the row is collapsed. “–“ indicates the row is expanded. Buttons do not display at the lowest level of that account or on total rows.
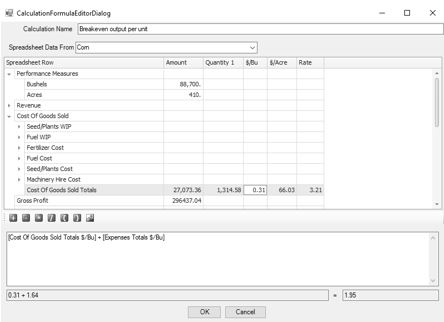
- Calculations allow modifying and adding calculated rows at the end of the analysis. The Calculation Formula Editor
 allows you to define the formula and view the values generated by the formula at the bottom of the screen.
- Select a calculation on the list and click Edit at the bottom to view or modify the formula.
- Select New to add a new calculation. Enter a Calculation Name.
- Spreadsheet Data From indicates which analysis segment the calculation editor is using to generate values. The drop-down allows selecting a different segment. The segment used is for viewing results in the formula. The calculation will be applied to all segments in the analysis.
- Spreadsheet Row displays all rows available in the spreadsheet beginning with performance measures and followed by the account types included in the analysis.
- All transaction data columns and performance measure columns in the analysis spreadsheet are available for selection.
- Each account type section at the left can be expanded to access individual account rows, account category total rows, or account type total rows.
- Clicking in an empty cell within the grid drops down the rows available in that section.
- Cells populated with values from the spreadsheet can be used in the calculation formula.
- Double-click in a cell you wish to add to the calculation formula. You will see that cell name displayed in the formula box.
- Below the spreadsheet rows are mathematical functions
 that can be included in the formula. Double-click a function icon to add it to the formula.
- For example, if you wanted to add a calculation row for Breakeven output per production unit, double-click in the cell of row Cost of Goods > Cost of Goods Sold Totals in column $/Bu.
- [Cost of Goods Sold Totals $/Bu] is added to the formula box.
- Next double-click the Function icon for add
 and + is added to formula.
 - Next double-click the row Expenses > Expenses Totals in column $/Bu. [Expenses Totals $/Bu] is added to the formula box.
- The formula updates to [Cost Of Goods Sold Totals $/Bu] + [Expenses Totals $/Bu].
- The results of the formula (based on the Spreadsheet Data From selection) display at the bottom of the editor. In this example the results indicate the price per bushel required to breakeven.
- Verify the calculation at the bottom of the screen. Make sure that your formula string has the items and functions ordered as needed. Typical spreadsheet formula rules are utilized. Manual inputs can also be used in the formula.
- Click OK when the formula is complete for this calculation.
- Selecting the check box for the Calculation includes the calculated row at the end of the analysis.
- Delete removes a selected calculation.
- View
 provides display options.
- Headings displays spreadsheet lettered column headings. When Headings is turned on, column widths can be modified by dragging the column separators in the Headings row to a desired width. The changes will be used during print, preview, and export functions. While in Headings mode, you also have the ability to change a row height by dragging the numbered row grid line at the far left.
- After modifications to widths and heights are complete, turning off Headings retains the changes while working in the analysis.
- Gridlines display when checked and are hidden when unchecked.
- Show/Hide Columns
 - allows selecting columns you want to show or hide.
- Click the drop-down to view the columns included in each segment.
- The selection toggles between show column and hide column.
- Edit
 defines which column you wish to change values for “what if” strategy planning or other modifications to the analysis.
- Values can be changed in one column at a time. Transaction Amount allows changes in the Amount column or Quantity columns. Each Performance Measure included in the Edit columns.
- Value changes can be made in the lowest level displayed in the analysis. Click the mouse in the cell and enter the new value. If the cursor does not display, select the appropriate column in the Edit options and verify the row is expanded to the lowest level.
- Changing a value recalculates the other columns based on the new value. For example, the columns displayed are Transaction Amounts, $/Acre, and $/Bushel. Edit selection is $/Bushel. Changing a value in $/Bushel recalculates the total dollars and $/Acre in that row.
- Changing a Performance Measure value at the top of the segment recalculates the column assigned to the performance measure. For example, changing the number of acres in the performance measure recalculates $/Acre column in that segment.
- Value changes are retained while the analysis is open and included in print, preview, or export of the reports. When the analysis is closed, the values reload current transaction activity. The report can be exported if you wish to save your changes.
Map Options
The Map menu provides the following options to display your geo-spatial shapes.
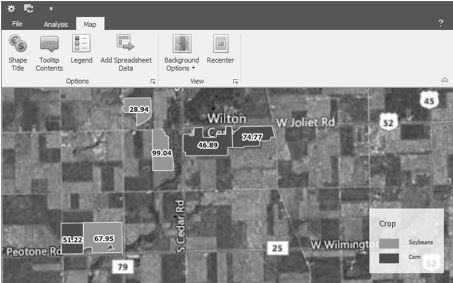
- Shape Title selects the Title Attribute that labels each shape (field) included in the analysis.
- Tooltip Contents defines the attributes included in the tooltip for each shape.
- The tooltip displays as you hover your mouse over a shape.
- Legend defines the attribute, color, and map legend position.
- The legend and the shape title can use different attributes. The result is using two pieces of information at one time in your map display.
- The colors (Legend) identify one piece of information and the label (Shape Title) is another.
- Add Spreadsheet Data allows adding other attributes from the analysis spreadsheet that you wish to use for shape titles or legends. The Shape Title in the above example assigned an attribute that represents Net profit/loss from operations $/Acre.
- Recenter returns the zoom focus to center the production centers or production center details included in the analysis.
- Refer to the document Using Maps in Production Analysis for detailed information about using map features.
Toolbar Preferences
The Production Analysis toolbar can be customized. Your selections are remembered and can be changed at any time.
Production Analysis installs the following menu:
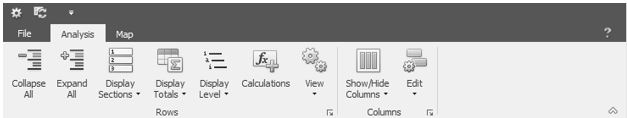
- Across the top of the screen, the File menu drops down the File menu options.
- The Analysis menu displays a toolbar ribbon that can be collapsed or expanded. The above view is expanded.
- Click the down arrow at the far right to collapse the toolbar ribbon.
- Click the up arrow at the far right to expand the toolbar ribbon.
- The Map menu displays a toolbar ribbon that can be collapsed or expanded.
- The Analysis menu and Map menu share the same toolbar ribbon preference.
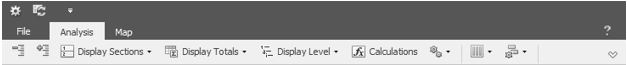
- A Quick Access Toolbar displays below the ribbon.
- The Quick Access Toolbar menu includes Properties and Reload.
- Click the down arrow to the right of the icons and select Show Quick Access Toolbar Above the Ribbon if you wish to move the Quick Access Toolbar to the top of the screen.
- From the Quick Access Toolbar above the ribbon, click the down arrow and select Show Quick Access Toolbar Below the Ribbon to move the Quick Access Toolbar to the original position.
- The toolbar ribbon can be minimized to hide the entire toolbar.
- Right-click in the toolbar and select Minimize the Ribbon to hide the ribbon.
- To display the ribbon again, select either the Analysis menu option or the Map menu option and right-click in the toolbar. Uncheck Minimize the Ribbon.
- The following is a display of the Quick Access Toolbar at the top and a collapsed ribbon.
Other Analysis Tools
- When working in Production Analysis and you right-click on an account row, a menu displays with options \. Cells allow inputs also, therefore the right-click options do not display when the cursor position is in the cell. A tip is to right-click on a column cell before left clicking in that cell.
- Set Column Width changes the width assigned to the selected column. Changing the width will reset the width of this column in all segments.
- Set Number Format defines the number of decimals you wish to use for the selected column. Changing the number of decimals is recognized for this column in all segments.
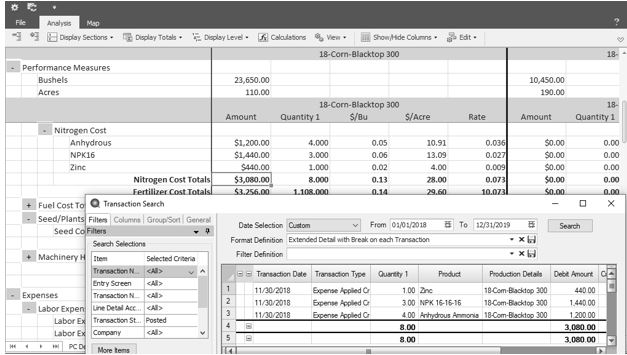
- Review Transactions drills down into account activity. The Transaction Search screen displays the individual transaction activity.
- When drilling down, you will typically want to use a format that includes details rather than the summary. The first time you drill-down, change the Format Definition to a format you have with details such as “Extended detail with Break on each Transaction”. If you need to add or remove columns you wish to view, use the Columns tab at the left. When finished, click the Save icon at the far right of the Format Definition row. Check the box to “Set as Default Definition”. Click OK. Select “Yes” to overwrite the existing format. Close the search screen and right click again to Review Transactions. Your results will be displayed with the desired details.
- The default Format Definition also applies in Reporting Tools > Transaction Search. You can switch the default Format Definition at any time.
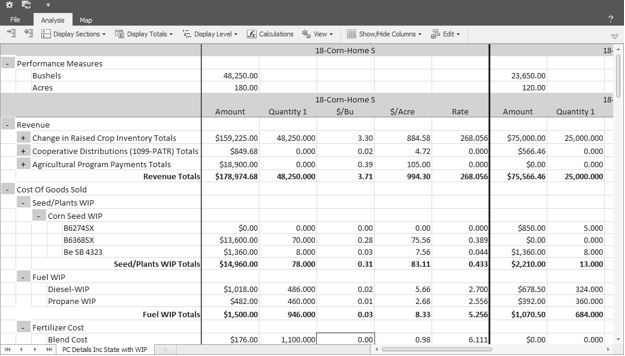
Using Formats with WIP Accounts
In Properties > Format Rows > Format, some format options include WIP accounts to provide a way to view all your inputs into the production before they are expensed. This allows capturing all the costs of the production prior to harvest for analysis purposes.
If you have just begun assigning production details to your WIP Account balances either at the time of purchase or using Production > Apply Crop Inputs by Field, it is possible you have prior WIP activity that have no production detail at the time it was purchased. In a Production Analysis that includes WIP accounts, the result will be that you see the activity that decreased the WIP accounts, but the not the activity that originally increased the WIP activity represented in this production.
This situation can be recognized with negative amounts in the Cost of Goods section in the WIP account rows. When the WIP accounts have been expensed, you will also see the activity in the cost accounts. If the purchase into WIP (or transfer to WIP) AND the expensing of WIP to cost of goods BOTH include the production details, the result is equal to zero.
When negative amounts exist in the Cost of Goods account section in the WIP account rows, AND you have identified these are due to not seeing increases to the WIP accounts for this production detail, you can zero the values in these rows for analysis purposes.
In your next year production cycle, this issue will be eliminated because all WIP activity will have production detail when it is increased and decreased.
|
Document: 3371 |
|---|