CenterPoint® Accounting for Agriculture
- Production Analysis (WIP)
Related Help
_24.jpg) Setting Up a Production Analysis Video - Duration: 16 min 56 sec
Setting Up a Production Analysis Video - Duration: 16 min 56 sec
Working with Production Analysis Video - Duration: 15 min 03 sec
Calculations in Production Analysis Video - Duration: 7 min 20 sec
Working with Production Analysis Maps Video - Duration: 8 min 45 sec
Printing Production Analysis Maps Video - Duration: 3 min 0 sec
 View or Print as PDF
| Document #: | 3370 | Product: | CenterPoint® Accounting for Agriculture |
|---|
Production Analysis is a management tool that performs profitability comparisons on the individual areas of your operation. Here are just a few examples a crop operation may want to analyze:
- Fields that grew a specific crop to see which fields are most productive.
- All Crop Profit Centers to determine which crop is most profitable on a per acre basis.
- Activity by Lease Agreements to determine the profitability of rented ground.
Production Analysis > Analysis provides the results in a spreadsheet format and, additionally, a more visual comparison using geo-spatial maps. The geo-spatial maps stored in your production centers and production center details are utilized in Production Analysis. For details on using maps, refer to the document “Working with Production Analysis Maps”.
The analysis spreadsheet gathers data columns from transaction activity, as well as performance measure columns. Performance measures generate meaningful calculations of your production activity. Performance measures access different sources such as the number of acres or total production stored in the production center details, total quantity of sales accounts, or account balance information. Dollars Per Acre, Dollars Per Bushel, Dollars per Ton, Dollars per Head, or Dollars Per Units Sold are example uses of performance measures.
This document includes the following topics:
Setting Up a New Production Analysis (WIP)
- Under Reporting Tools > Production Analysis > Analysis (WIP).
- Select File > Open to open an existing Production Analysis.
- The File > Open screen also has a New button in the lower left.
- The Production Analysis currently open displays as the worksheet title at the bottom of the spreadsheet.
- On the left side of the screen, select General Properties.
- On the right side of the screen, select the Type. The types of available analysis (determined by the modules that have been installed) are displayed. Use General Analysis for activity other than crop or livestock.
- Groups provide a way to organize your production analysis reports in each Type. Select the Group for this analysis. Reports is the default. To add a group, enter a new group name, such as Crops by Field. When the analysis is generated, the new group name will be available to select for other analysis you wish to add in this group
For example, under Crop Analysis, you may define a group called Crop Profit Centers and a group called Crops by Field. Under each group, are the production analysis reports that are available for that group.
Under Livestock Analysis, you may define a group called Livestock Costs and a group called Livestock Income Statement. Under each group, are the production analysis reports that are available for that group.
In the Analysis field, enter a name that describes this report from other analysis reports. The Analysis name will be displayed in the File > Open menu option. Once an Analysis is created, it is available for future use. The analysis currently open displays as the worksheet title at the bottom of the spreadsheet.
-
On the left side of the screen, select Format Rows. Format Rows sets the type of activity and the level of accounts displayed in the analysis rows.
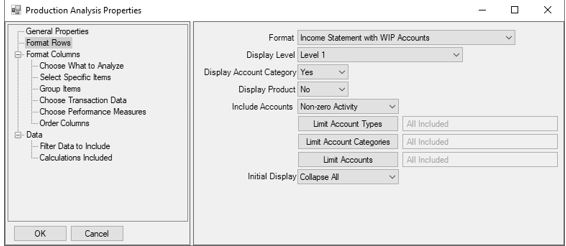
- Format defines which type of account activity you wish to include in the analysis. If you choose to use different combinations of account activity, you may want to include the Format type in the Analysis name. The Format options are:
- Income Statement - represents a typical accrual income statement representing revenues, cost of goods, and expense account activity.
- Income Statement with WIP Accounts - allows analyzing your input costs prior to the time of expensing the WIP accounts to cost of goods accounts. This is helpful to provide current costs of production prior to harvest. WIP account activity is included in the Costs of Goods section and decreases net profit in the analysis.
- Condensed Income Statement - combines Other Revenue account type with Revenue and combines Other Expense account type with Expense.
- Cost of Goods Accounts - accounts includes Cost of Goods account type accounts only..
- Cost of Goods with WIP Accounts - account type accounts and Work in Process account categories accounts in the Cost of Goods section.
- Cost of Goods with Expense Accounts - includes Cost of Goods account type accounts and Expense account type accounts.
- Cost of Goods with WIP and Expense Accounts -includes Cost of Goods account type accounts and Work in Process account categories accounts and Expense account type accounts.
- Display Level determines how the analysis data should be summarized:
- Account Categories - Produces one row per account category grouped by Account Type (Assets, Liabilities, Expenses, Revenues, Cost of Goods Sold, etc.)
- Level 1 - Produces one row for each level 1 account (if there are level 2 or 3 accounts, their totals are rolled up into their parent level 1 account) grouped by Account Type and Category.
- Level 2 - Produces one row for each postable account up to level 2 (if there are level 3 accounts, their totals are rolled up into their parent level 2 account) grouped by Account Type, Category, and Level 1 Account
- Level 3 - Produces one row for each postable account grouped by Account Type.
- Items – Produces one row for each item, such as fixed assets, grouped by its parent account.
- Postable Accounts - Produces one row for each postable account (lowest level account) grouped by Account Type. For example, if you have a Level 1 account called Fuel, a Level 2 account called Diesel and another Level 2 account called Regular Gas, you would be able to post to the Diesel and Regular Gas accounts (lowest level) but not the Fuel account.
- Display Account Category - sets if Account Category headings display or are hidden. Select Yes to display and No to hide Account Category headings.
- Display Product - produces one row for each Product maintained under a Work in Process or Raw Material account where products are used. Select Yes to include Product rows and No to summarize the activity by the WIP account or RM account.
- Include Accounts - sets if you wish to include activity rows with zero total. Select Non-zero Activity to hide rows that total zero. Select All Activity to include zero rows..
- Click Limit Account Types to select the account types you wish to include or exclude. Selecting Limit Account Types displays a list of Account Types. Use the right arrow to move an account type from the left column to the right column. Select the Exclude selected items box to exclude the items on the right. If no selections are indicated, the analysis Format determines the account types included.
- Click Limit Account Categories to select the account categories you wish to include or exclude. Selecting Limit Account Categories displays a list of Account Categories. Select the account categories you wish to include by using the right arrow to move an account category from the left column to the right column. Select the Exclude selected items box to exclude the items on the right. If no selections are indicated, the analysis Format determines the account categories included.
- Click Limit Accounts allows you to select the accounts you wish to include or exclude. Selecting Limit Accounts displays a list of Accounts. Use the right arrow to move an account from the left column to the right column. Select the Exclude selected items box to exclude the items on the right. If no selections are indicated, the analysis Format determines the accounts included.
Initial Display - sets if the spreadsheet defaults with all account levels collapsed or expanded. Rows can be expanded and collapsed from the spreadsheet as well. Select Collapsed or Expanded default option.
- On the left side of the screen, the Format Columns section sets the production detail analyzed, the transaction data columns included, and the calculated columns included for each row.
From the left side of the screen, select Choose What to Analyze to determine which piece of production detail you wish to analyze. The options are as listed under Analyze Data By:
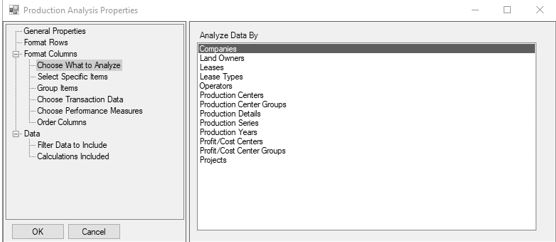
- Companies
- Land Owners
- Leases
- Lease Types
- Operators
- Production Centers
- Production Center Groups
- Production Details
- Production Series
- Production Years
- Profit/Cost Centers
- Profit/Cost Center Groups
- Projects
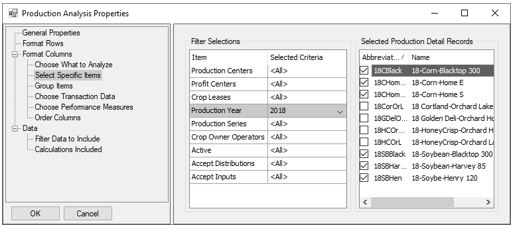
From the left side of the screen, select Specific Items to display the list of available items based on the “Choose What to Analyze” selection. Select the items you wish to include in the analysis using the right arrow to move an item from the Available list on the left to the Selected list on the right
Analyzing by Production Details displays a Filter Selection to limit the items included in the list. For example, selecting Production Year and setting the filter to “Equal to” 2018 filters the production center details to those with production year 2018. Check the boxes of the items you wish to include.
Analyzing by Production Year or Production Series provides a field to enter the year or series you wish to include. Click Add to add the year or series. Click Clear All to remove all items added. Select an item and click Remove to remove one item.
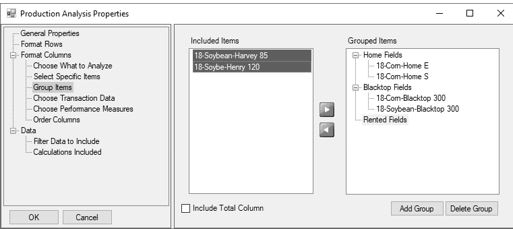
From the left side of the screen, select Group Items to combine items to a group name. Items in a group display as one column segment in the analysis.
- Click Add Group, enter a Group Name, and then click OK. The group name displays under the Grouped Items column on the right side of the screen.
- To add items to a group, first select the group name on the right.
- Next, under the Included Items column on the left side of the screen, select the item you wish to add to the group on the left.
- To add items to a group, under the Group Items column on the right side of the screen, first select the group name.
- Multiple items can be selected by holding down the CTRL key while making your selections. Click the right arrow to add items under the Grouped Items column to the selected group.
- To unselect an item from a group, select the item from the Group Items column on the right and click the left arrow.
- Delete Group removes a selected group name. Items in a deleted group return to the Included Items. Items not included in a group display as individual segments in the analysis.
Form the left side of the screen, select Choose Transaction Data to select the transaction data displayed as a column in each analysis segment.
- From the right side of the screen, select a Transaction Data column check box. You may include as many columns as you wish. Selected columns display in each analysis segment.
- The Label box to the right of the selected Transaction Data displays the default column Label for the selected Transaction Data. The label can be modified.
- The Transaction Data columns are:
- Amount
- Quantity 1
- Q1 Units of Measure (displays UOM assigned to account Quantity 1)
- Quantity 2
- Q2 Units of Measure (displays UOM assigned to account Quantity 2)
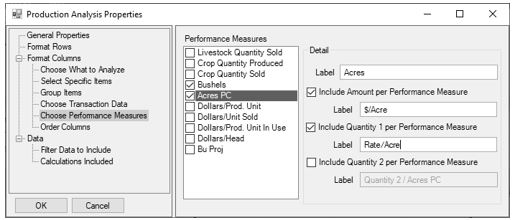
Form the left side of the screen, select Choose Performance Measures to select the calculated columns you want performed in each analysis segment. A predefined list of performance measures displays at the left. See the Setting Up Performance Measures topic for details on the calculations used in performance measures and how to add new performance measures.
- From the right side of the screen, select the Performance Measures you wish to include. Selecting a performance measure displays the Label to the right of the selected performance measure.
- The Performance Measure label displays at the top of the analysis spreadsheet with the values in each segment.
- For example, if you select the performance measure “Acres from PC Detail”, the acres are retrieved from the production center details and display at the top of the analysis in each segment.
- Select which transaction data you wish to use with this Performance Measure. The options are Amount, Quantity 1, and Quantity 2.
- Selecting to Include Amount per Performance Measure includes a column that calculates the dollars in each row divided by the performance measure. In the same performance measure example of “Acres from PC Detail”, the Acres column in that segment represents “$/Acre”.
- Selecting Include Quantity 1 per Performance Measure includes a column that calculates the Quantity 1 value in each row divided by the acres in that segment representing “Rate/Acre”.
- Column labels can be modified. In this example you would modify the label for Include Amount per Performance Measure with $/Acre and modify the label for Include Q1 per Performance Measure with Rate/Acre.
- Each included option adds a column. Selected columns display in each analysis segment.
- Form the left side of the screen, select Order Columns allows you to order the segments and columns you have selected in your analysis. Use the up and down green arrows to order the columns as needed.
- On the right side of the screen under the Analyze Groups column the specific production details selected in this analysis are listed. Use the green up and down arrows to order the segments.
- Under the Analyze Columns column the transaction data columns and performance measure columns selected in this analysis are listed. Use the green up and down arrows to order the columns. Each set of columns is displayed in each segment.
- As you work in the spreadsheet, the row titles at the left “freeze” so they remain visible as you scroll to the various segments included in the analysis.
- From the left side of the screen, the Data section provides ways to filter the data included in the analysis and add additional calculated rows at the end of the analysis.
- Select Filter Data to Include to display options that allow you to filter the data.
- You can filter your production analysis by other specified criteria. Filters apply additional limitations of data beyond the selections used in “Choose What to Analyze”.
- For example, if you chose to analyze all crop profit centers, you may want to filter for a specific production year. In the list of filters, select Production Year. Set the parameter to “Equal to” and enter the year you wish to analyze.
- Another example, if you chose to analyze several production years and you want to look at just specific profit centers. In the list of filters, select Profit Center. Use the green right arrow to move the profit center(s) you wish to include from the Available column on the left to the Selected column on the right.
- If you want to exclude items from the analysis, select the items and then click the Exclude Selected Items check box.
- If you do not see a filter option, click the More Items button, select the filter option, and then click OK. You will then be able to define filter criteria for that option. Unselecting an option removes it from the current list. Click OK to accept changes.
- Select Calculations Included to add other calculated rows at the end of the analysis. Some calculations have been predefined for you. New calculations can be added from the menu Analysis > Calculations.
- Select the calculation you wish to include as a calculation row at the end of the analysis.
- Delete removes a selected calculation.
-
Click OK in the lower left to generate the analysis. Cancel closes the analysis definition screen.
Formats with User Defined Reports
- User Defined Reports can be used as a format for your Production Analysis. This option allows the user to assign specific accounts and transaction types included in the analysis.
- Select Setup > User-Defined/ Tax Reports.
- Select New to create a new user defined report.
- Enter an abbreviation and a name for the report.
- In Type box, select User Created.
- Uncheck Require All Accounts to be Assigned.
- Refer to the document on User Defined Reports to assign Row titles, Columns, and Account Assignments.
- Save the report.
- User-defined reports with the Type User Created are included in the Production Analysis Properties > Format Rows > Format list.
- When the user defined report is selected in the Format, the Production Analysis will gather transaction activity based on the user-defined report selections.
|
Document: 3370 |
|---|