CenterPoint® Accounting
- Dashboards
Related Help
_24.jpg) Dashboards Video - Duration: 12 min 58 sec
Dashboards Video - Duration: 12 min 58 sec

The Dashboard allows you to view performance and financial information upon CenterPoint start up or with the Reporting Tools > Dashboard menu. The Dashboard provides a quick overview of your business and allows you to access the report that generated the information. The default Dashboard can be customized for your specific needs.
Set the Dashboard Preference (One-time Setup)
Example 1: Add Dashboard Tile using Report Selection Filters
Example 2: Add Dashboard Tile using Additional Filters
Add a Dashboard Tile Similar to Another
Change which Dashboard Tiles Display
Display Report Properties for a Dashboard Tile
Display the Associated Report for a Dashboard Tile
Set the Dashboard Preference (One-time Setup)
- Select File > Preferences > General > Dashboard.
- Select the Application tab.
- If you want to display the Dashboard when CenterPoint is opened, in the Display on Startup box, select Yes.
- If you want your Dashboard information saved to a location other than the default "<Documents>\CenterPoint\Dashboard\", in the Location of saved dashboard tiles box, select an alternate location.
- Click Save.
View the Default Dashboard
- If you have not set the Dashboard to display each time CenterPoint is opened, select Reporting Tools > Dashboard.
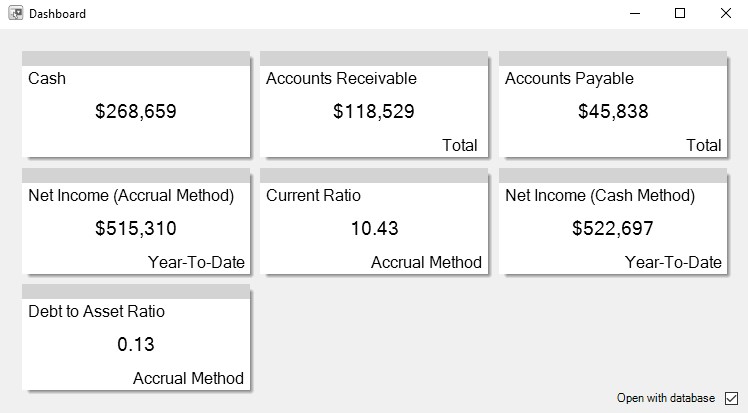
- If you did not set the Dashboard to display upon CenterPoint start up, you can choose to open the Dashboard with this database and set the Display on Startup in File > Preferences > General > Dashboard by selecting the Open with Database check box.
Create a New Dashboard Tile
Example 1: Add Dashboard Tile using Report Selection Filters
- On the Dashboard screen, right-click and select Add/Remove Tiles.
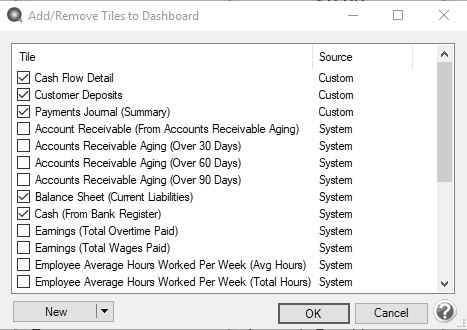
- Click the drop-down arrow on the New button and then select Report Tile.
- The Reports screen will open behind the Dashboard. Select the report you want to add a Dashboard tile from. For example, from the Reports screen, select Transaction Reports > General Ledger > General Ledger Activity.
- Define your Report Selection Filters and then click Preview. The report selections will be used to filter the dashboard tile you create. For example, if you filter the date to This Month, the tile will always display data for the current month or in this example, the report should be filtered to include only Account 700000 Utilities Expense.
- From the Preview toolbar, click the Add to Dashboard icon
 to display the Add Dashboard Tile screen.
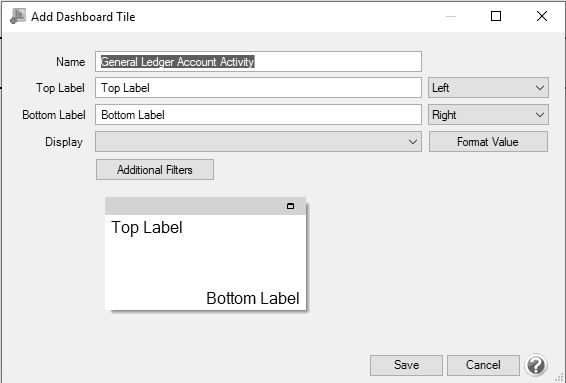
- The Name box will display the report you selected in step 3. You can change this name to be more specific if you have more than one tile generated from this report.
- In the Top Label box, enter the text you want to display in the upper portion of the Dashboard tile. For example, Utilities Expense. Then, select if you want the text to display from the left, in the center, or from the right side of the tile.
- In the Bottom Label box, enter the text you want to display in the lower right corner of the Dashboard tile. For example, From Account 700000. Then, select if you want the text to display from the Left, in the Center, or from the Right side of the Dashboard tile.
- In the Display box, specific information about the data the report displays will need to be defined so the Dashboard tile can display the information you want to view. For example, for the General Ledger Activity report the selections are Debits or Credits. In this example, the information viewed will be what has been spent in an Expense account, so Debits were selected.
- Click the Format Value button to display the Set Number Format screen.
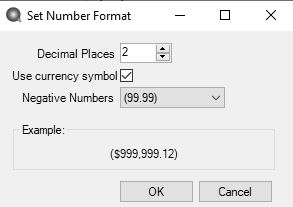
- In the Decimal Places box, select the number of decimal places you want to view, select the Use currency symbol check box to add a $ sign to totals, determine if Negative Numbers should display with a negative sign or in parenthesis, and then click OK.
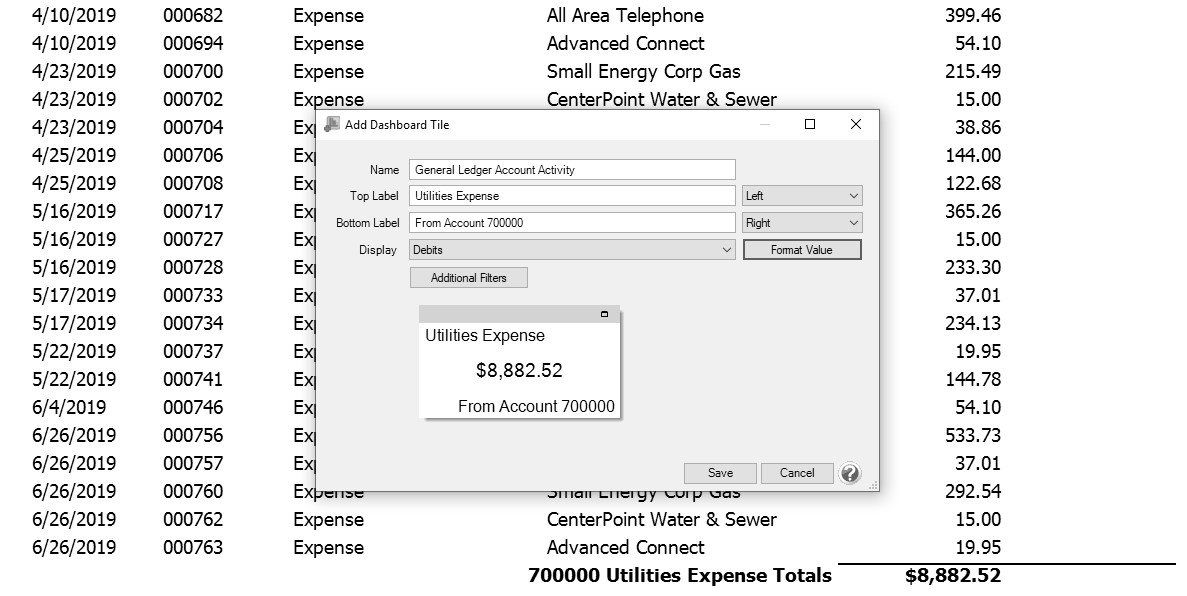
- Click Save.The new Dashboard tile will now appear on the Dashboard screen.
Example 2: Add Dashboard Tile using Additional Filters
- On the Dashboard screen, right-click and select Add/Remove Tiles.
- Click the drop-down arrow on the New button and then select Report Tile.
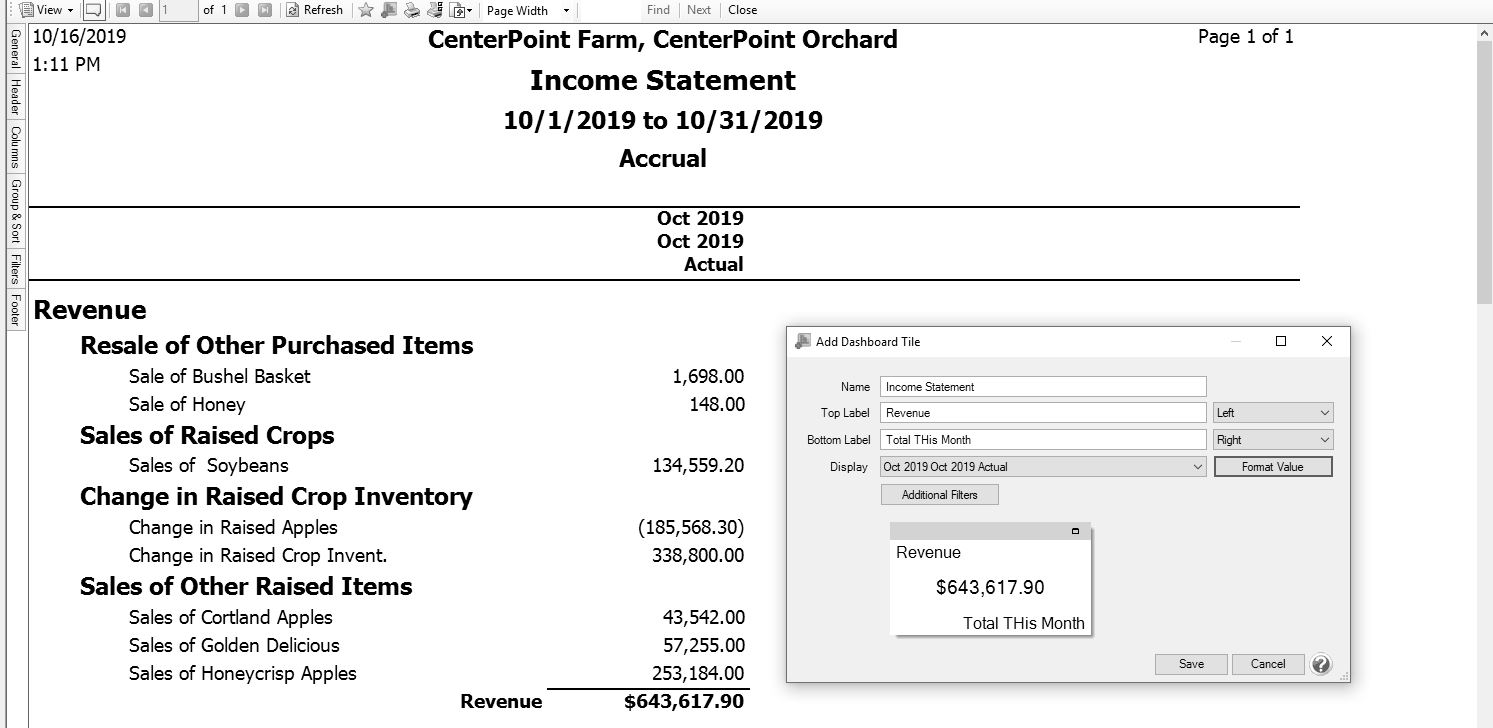
- The Reports screen will open behind the Dashboard. Select the report you want to add a Dashboard tile from. For example, from the Reports screen, select Financial Statements > Income Statement.
- Define your Report Selection Filters and then click Preview. The report selections will be used to filter the dashboard tile you create. For example, if you filter the date to This Month, the tile will always display data for the current month.
- From the Preview toolbar, click the Add to Dashboard icon to display the Add Dashboard Tile screen.
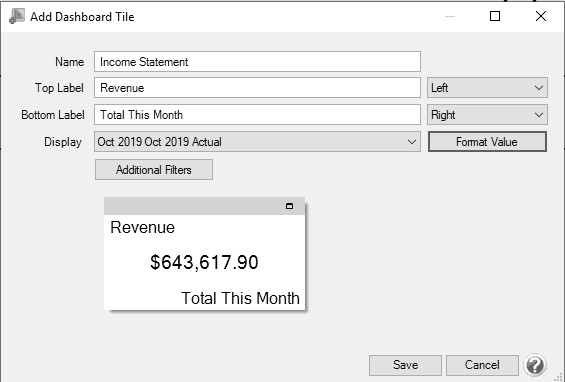
- The Name box will display the report you selected in step 3. You can change this name to be more specific if you have more than one tile generated from this report.
- In the Top Label box, enter the text you want to display in the upper portion of the Dashboard tile. For example, Revenue. Then, select if you want the text to display from the left, in the center, or from the right side of the tile.
- In the Bottom Label box, enter the text you want to display in the lower right corner of the Dashboard tile. For example, Total This Month. Then, select if you want the text to display from the Left, in the Center, or from the Right side of the Dashboard tile.
- In the Display box, specific information about the data the report displays will need to be defined so the Dashboard tile can display the information you want to view. For example, for the Income Statement report the selection period was selected to display This Month. In this example, the information viewed will be for October 2019 Actual.
- Click the Format Value button to display the Set Number Format screen.
- In the Decimal Places box, select the number of decimal places you want to view, select the Use currency symbol check box to add a $ sign to totals, determine if Negative Numbers should display with a negative sign or in parenthesis, and then click OK.
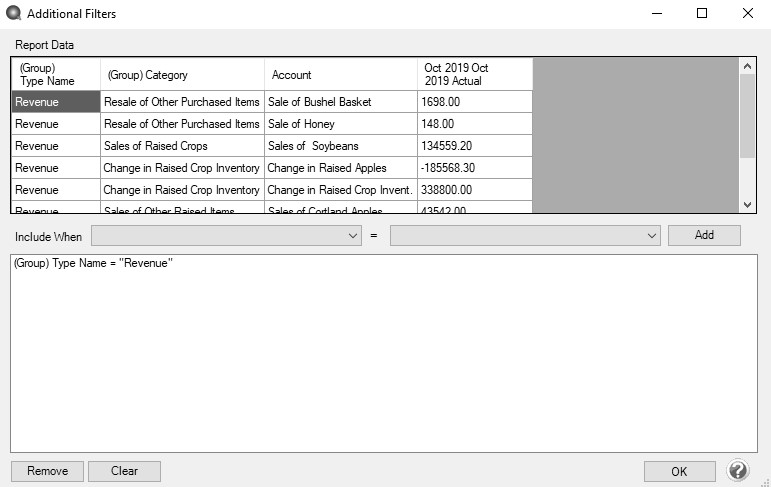
- Click Additional Filters to select the specifics that you want to appear on the Report Tile. In this example, the total of the Revenue subset of accounts should be displayed.
- Click Save.The new Dashboard tile will now appear on the Dashboard screen.
Example 3: Add a Dashboard Tile as a Chart from a Report
- Select Reports > Reports, select a report that you want to view as a chart on the Dashboard. Define your report selection filters, and then click Preview.
- Click the Add to Dashboard as Chart icon
 . The Add Dashboard Tile screen displays.
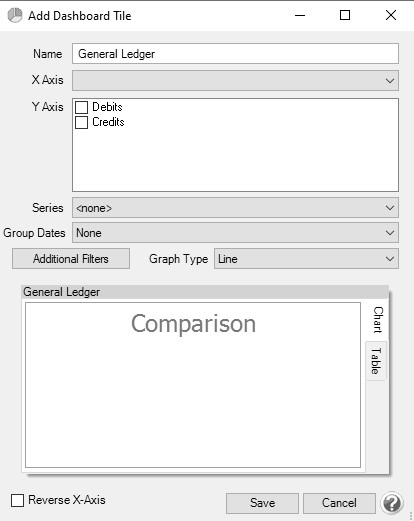
- The Name box will display the report you selected in step 3. You can change this name to be more specific if you have more than one tile generated from this report.
- Select the information you want to display on the X Axis of the chart (horizontal rows axis). The information varies by report, for example the General Ledger report X Axis options are Group (Account Number), Group (Account), Group Row Type Name, Transaction Date, Transaction Number, or Name/ Description.
- Select the information you want to display on the Y Axis of the chart (vertical column axis). The information varies by report, for example the General Ledger report Y Axis options are Debits and/or Credits.
- The Series box assigns titles for the row and column grouping combinations. When a selection is made in the Series box, one color and series title is assigned to each row group (x axis) and column (y axis) combination. For rows, the Series box is limited to text/integer columns for grouping the rows. It is recommended to only include CenterPoint reports with Product Year (Tracking Number 1), Production Series or other Year columns in a Series title for all other reports, select None. Charts always display a column label in the series titles for columns. Colors are always assigned to each row grouping on the x-axis. However, when None is selected, the series titles are only the column (y-axis titles).
- In the Group Date box, select from Month, Quarter, Year or None.
- Click Additional Filters to select the specifics that you want to appear on the Report Tile.
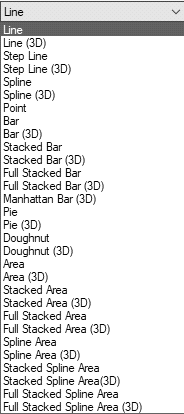
- Select a Graph Type, the options are:
- Select the Reverse X Axis checkbox to reverse the order of the X-Axis.
- Click Save.
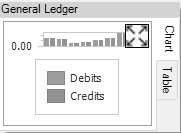
- The Dashboard Tile will be added to the Dashboard, for example:
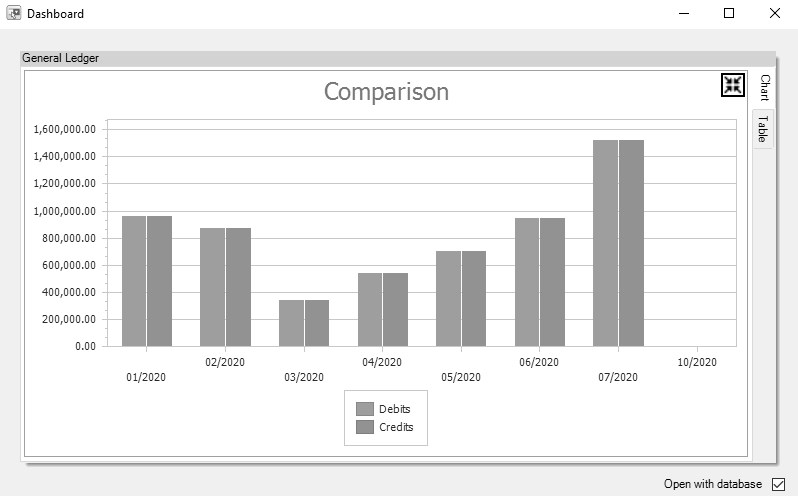
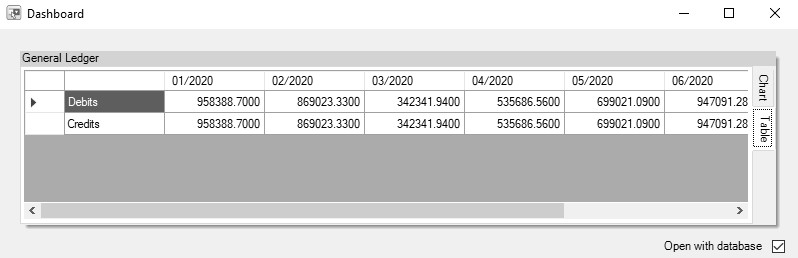
6. To Expand the Chart/Table, click  . In the examples below, the Add Dashboard Tile screen was defined from the General Ledger report, X Axis set to (Group) Account, Y Axis set to both Debits and Credits, Series set to None, Group Dates set to Month, and Graph Type set to Bar. To collapse the Chart/Table , click
Example 4: Add a Dashboard Tile from a Ratio
- Select Reports > Reporting Tools > Ratios.
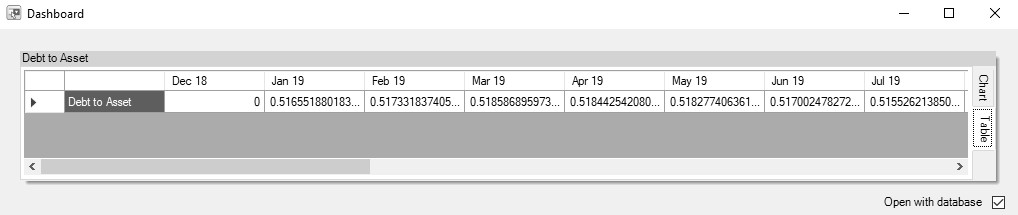
- On the left side of the screen, select the top-level of the tree, sub-level, or account cateogory of the tree (not the individual ratios), in the example below the top level is Debt to Asset, the sub-levels are Liabilities and Assets, and the account category level is Accounts Receivable..
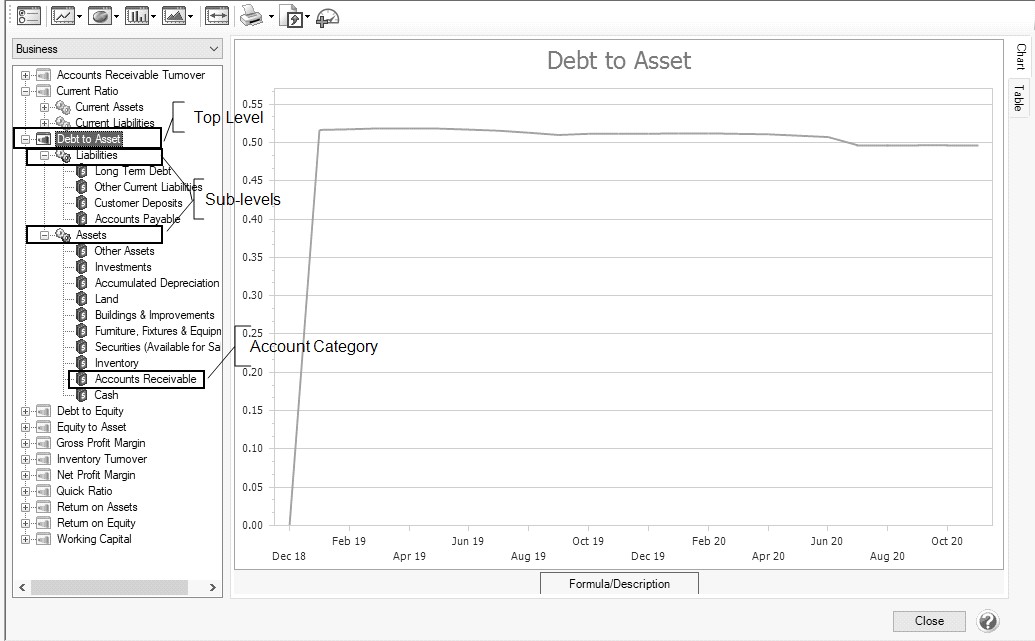
- Click the Add to Dashboard icon .
- At the Tile Saved message, click OK.
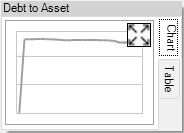
- The tile will be saved to the Dashboard, for example:
6. To Expand the Chart/Table tabs, click .
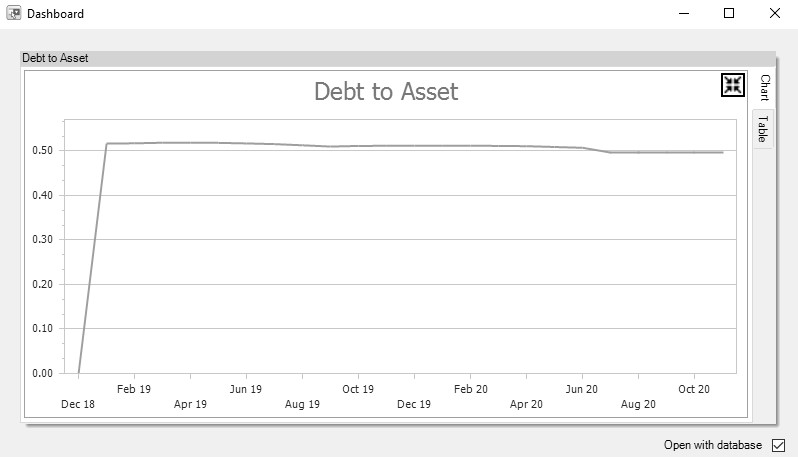
- To collapse the Chart/Table. click .
Add a Dashboard Tile Similar to Another
- On the Dashboard screen, right-click on the Dashboard tile you want to use to define another Dashboard tile, and then select Copy.
- Edit the existing information and Save the new Dashboard tile.
Edit a Dashboard Tile
- On the Dashboard screen, right-click on the Dashboard tile you want to change, and then select Edit.
- On the Edit Dashboard Tile screen, change the necessary information.
- Click Save.
Change which Dashboard Tiles Display
- On the Dashboard screen, right-click in a blank space, and then select Add/Remove Tiles.
- Select the Dashboard tiles you want to display on the Dashboard screen or unselect the Dashboard tiles you no longer wish to display on the Dashboard screen.
- Click OK.
Display Report Properties for a Dashboard Tile
- On the Dashboard screen, right-click on the Dashboard tile you want to display information for, and then select Properties.
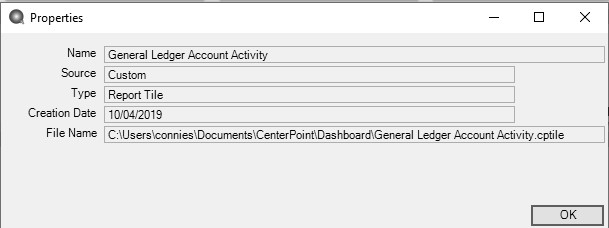
- Click OK.
Display the Associated Report for a Dashboard Tile
- On the Dashboard screen, right-click on the Dashboard tile you want to display the associated report for, and then select Open Report .
OR
- On the Dashboard screen, double-click on the Dashboard tile you want to display the associated report for.
Remove or Delete a Dashboard Tile
- To remove a dashboard tile from the Dashboard screen, on the Dashboard screen, right-click on the Dashboard tile you want to remove, and then select Remove.
- To delete a custom dashboard tile(s) from the Dashboard screen and from the Add/Remove Tiles to Dashboard screen, on the Dashboard screen, right-click, and then select Add/Remove Tiles. On the Add/Remove Tiles to Dashboard screen, select the tile(s) to delete, and then click Delete.
Refresh Dashboard Tile Information
- Dashboard information auto-refreshes on a regular basis. If you enter transactions into CenterPoint and the auto-refresh does not occur immediately, right-click on the applicable Dashboard tile, and then select Refresh.
|
Document: 3399 |
|---|